Data That Answers When You Ask
March 3, 2026 · Alf Viktor Williamsen
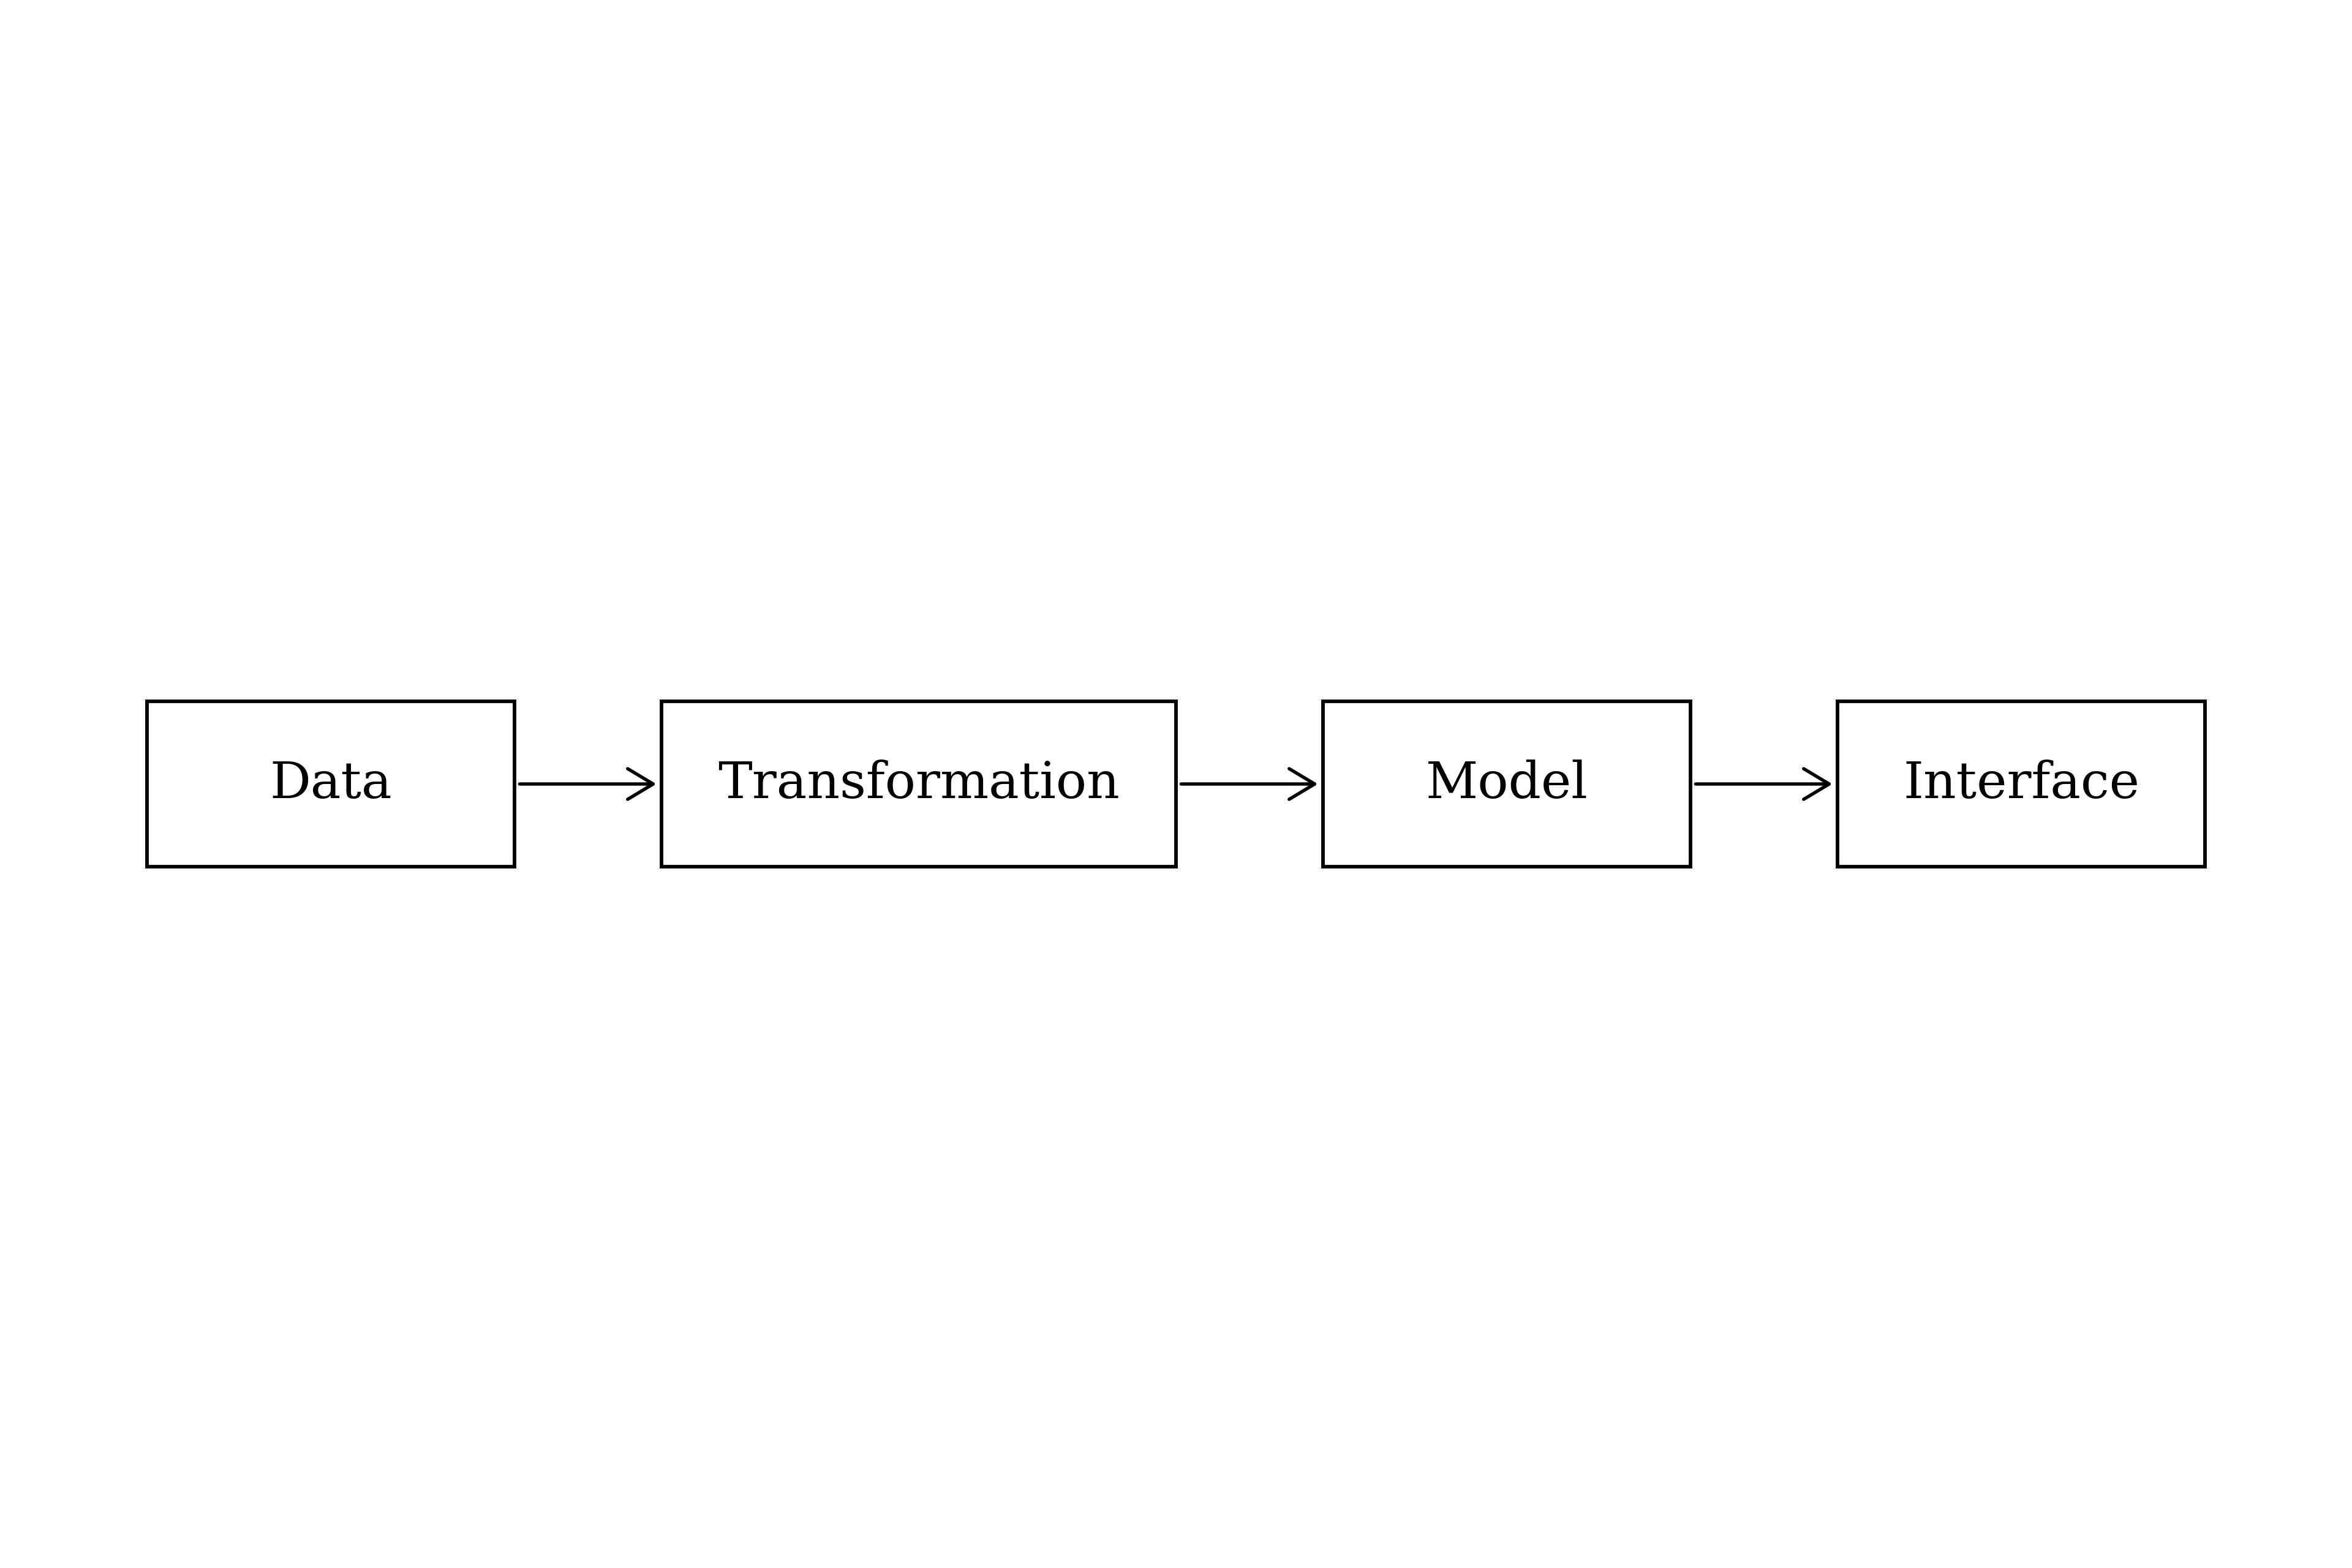
Businesses collect data perpetually: product types, customer profiles, refund rates, currencies, sales identifiers, personnel records. The combinations are infinite, and the more specific your business, the more novel the data types available for collection. But collection is not the hard part. The hard part is making the data useful: getting it out of scattered spreadsheets or systems, and into a structured store where it can help you answer questions and improve decisions.
In this article, I walk through a specific data flow from the insurance distribution business to present a framework for thinking about how data becomes useful. The goal is to make the example concrete enough that you can infer the key concepts and apply them to your own work.
Data Stuck in Spreadsheets
Inside the insurance distribution business, there is a vast information flow where sales, products, and commissions are transported through multiple steps. This data is communicated and shared inside spreadsheets, which are inherently difficult to work with in bulk.
The problem, stated simply: get the data out of the spreadsheets, clean up the structure, and funnel the data into a structured, queryable database like Postgres. What we end up with is a database that gets hydrated with new data at each period interval — data we can then work with downstream. Finding out who sells the most, what is selling the best, what products have a bad clawback rate, and more.
The goal of cleaning the data into a database is to create a single source of data truth. All data conforms to the same structure, allowing us to use the data stream inside our models to get insights.
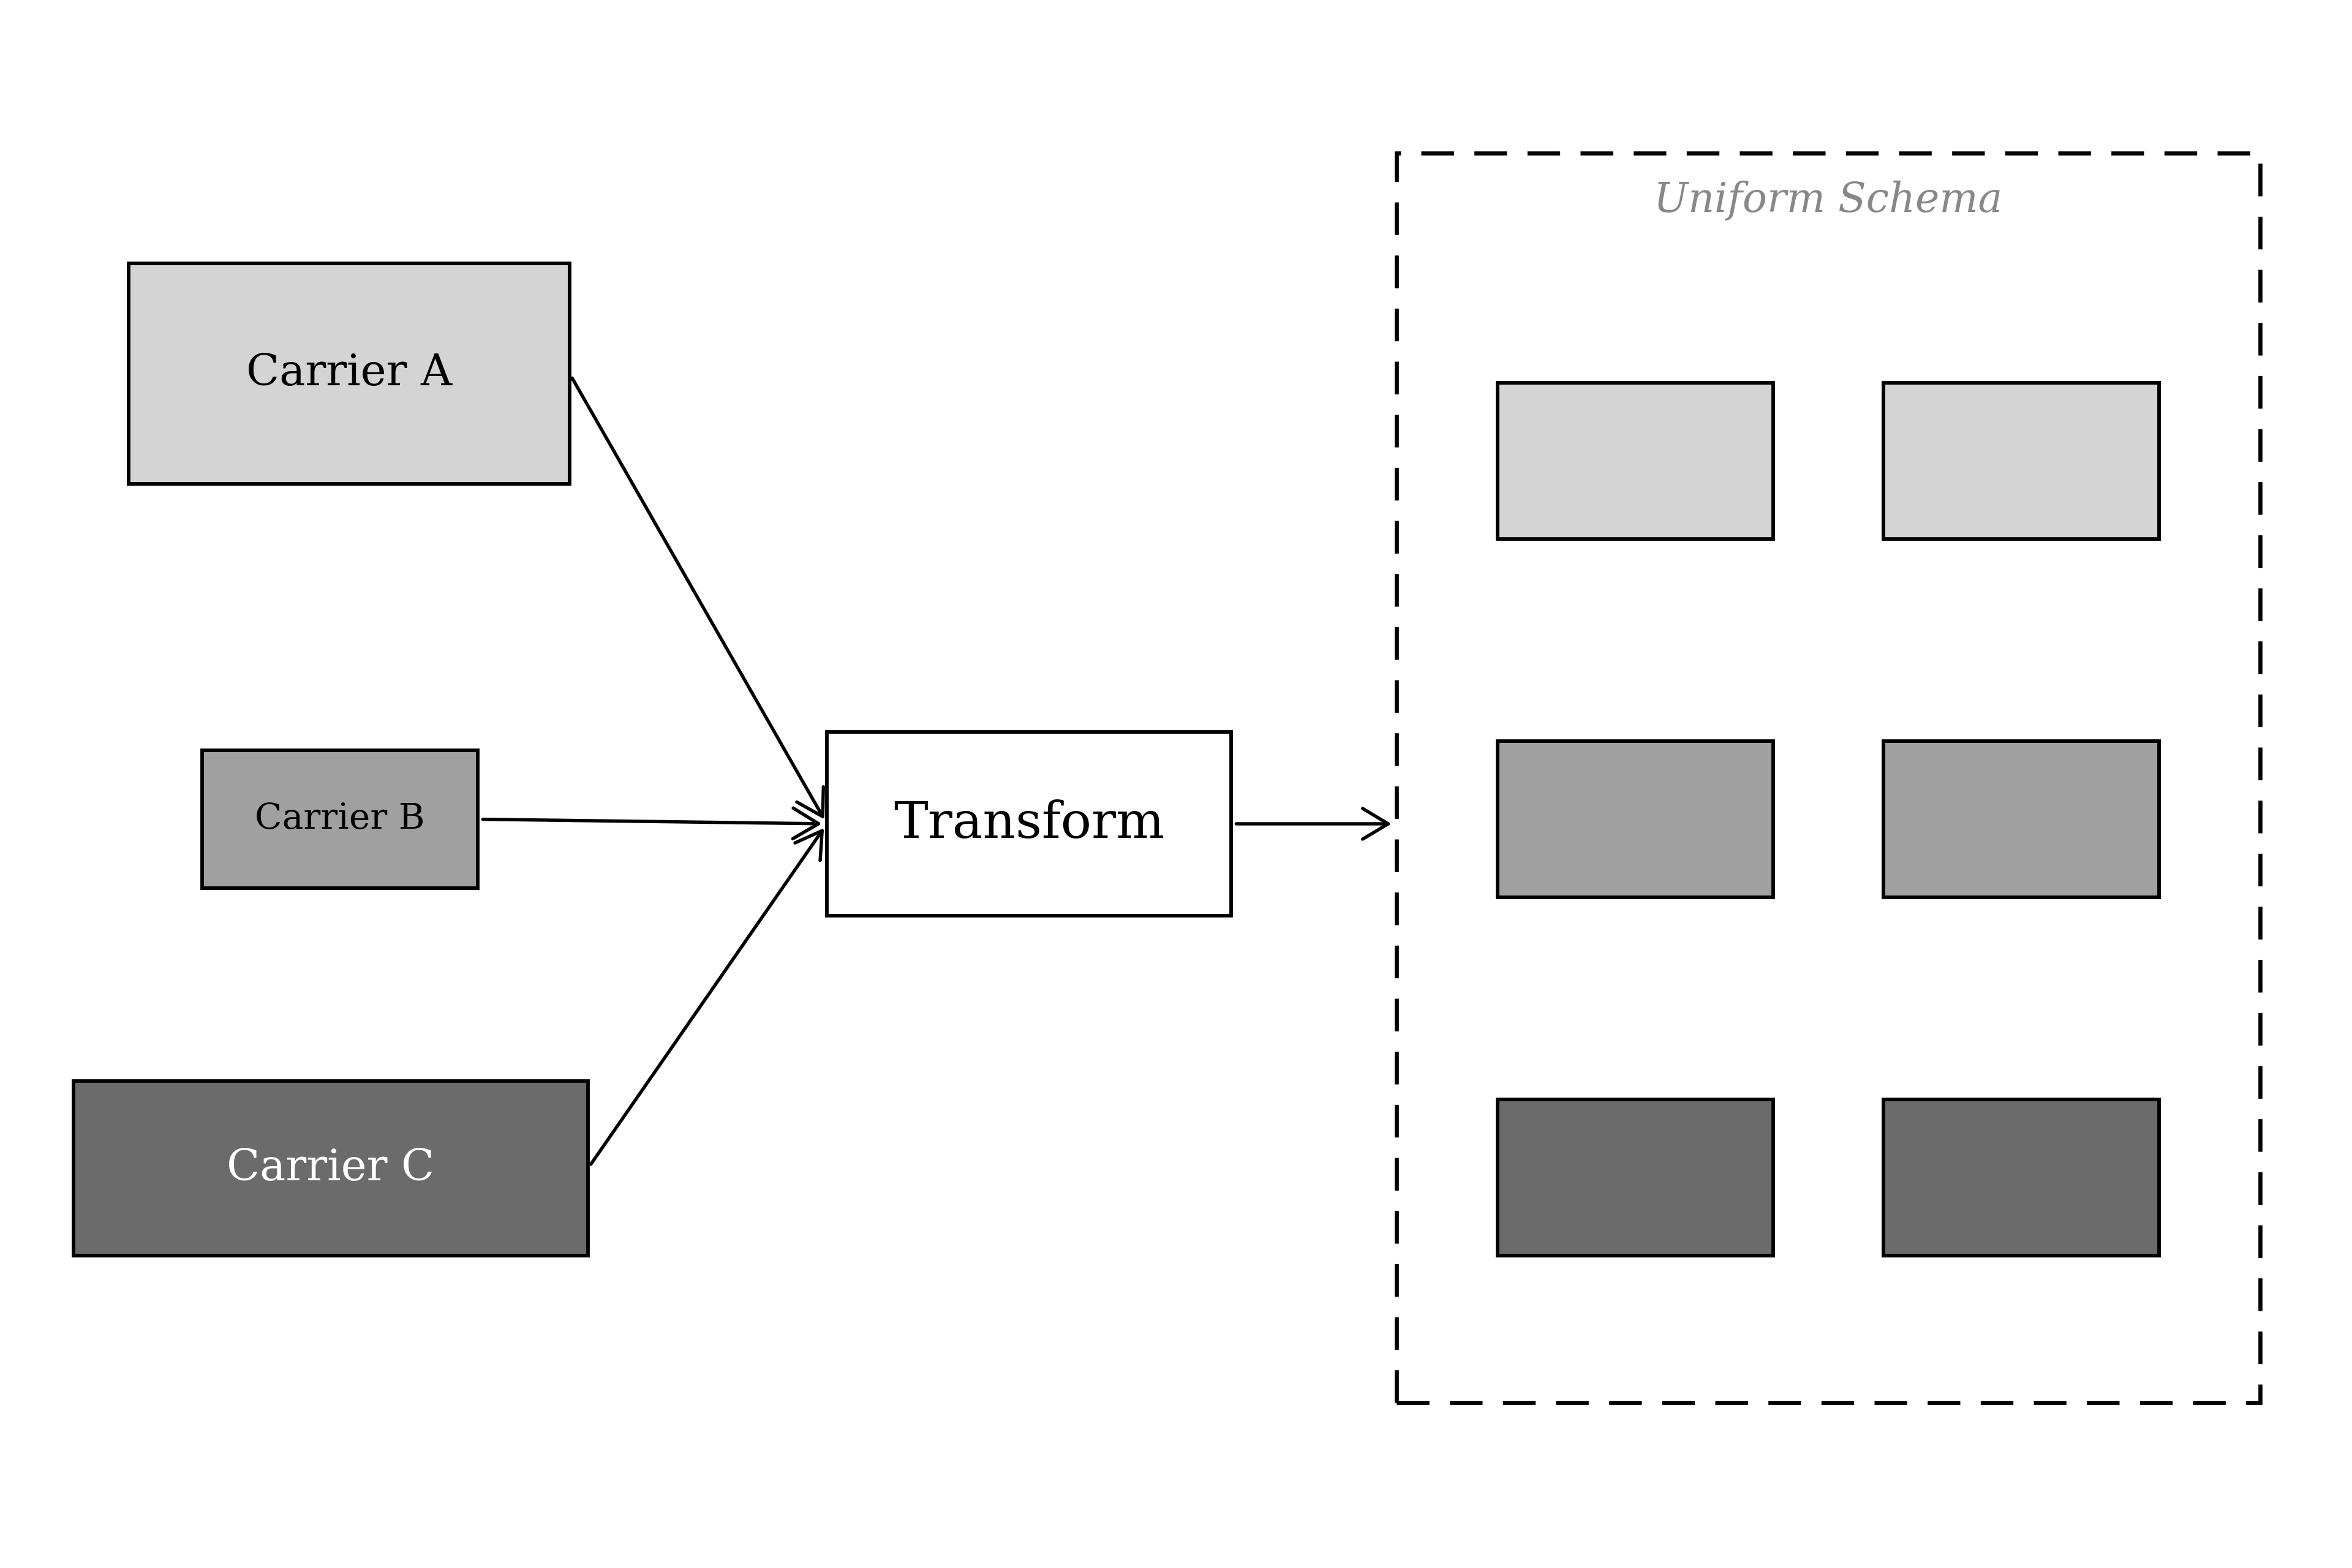
An analogy: imagine buying a bag of M&Ms. You expect every piece of candy to conform to a specific shape, weight, and taste. But each piece has a different color. Now apply this to transforming spreadsheets into our database format. We build a transformer that reformats the data into our desired shape and form, but we retain the key value of each data point. We keep its colors intact. When we scale this across tens to hundreds of spreadsheets, this becomes critical. If even one source has been parsed incorrectly, our models lose accuracy. Uniform shape lets us compare the colors.
One Schema for All Sources
For our insurance data flow, I am working with commission spreadsheets. Each spreadsheet has a different structure because each source is a different insurance carrier, each with different data systems. The most important task is to retain high resolution from each data source while transforming it to conform to our uniform schema for commission data.
The transformation is done with a Python backend written specifically for each commission type, which transforms the source to fit our uniform schema. For maximizing convenience, I have built the entire backend in the cloud: when users have new files, they simply forward an email to a custom address (with the spreadsheet files), which triggers the system to validate, transform, and store the data into the database. From there, the next chunk of work can be initiated immediately.
My goal as a systems engineer is to make purely necessary steps — like the data transformation — blend into the background. Make them as unnoticeable as possible so the app experience does not feel like another spreadsheet.
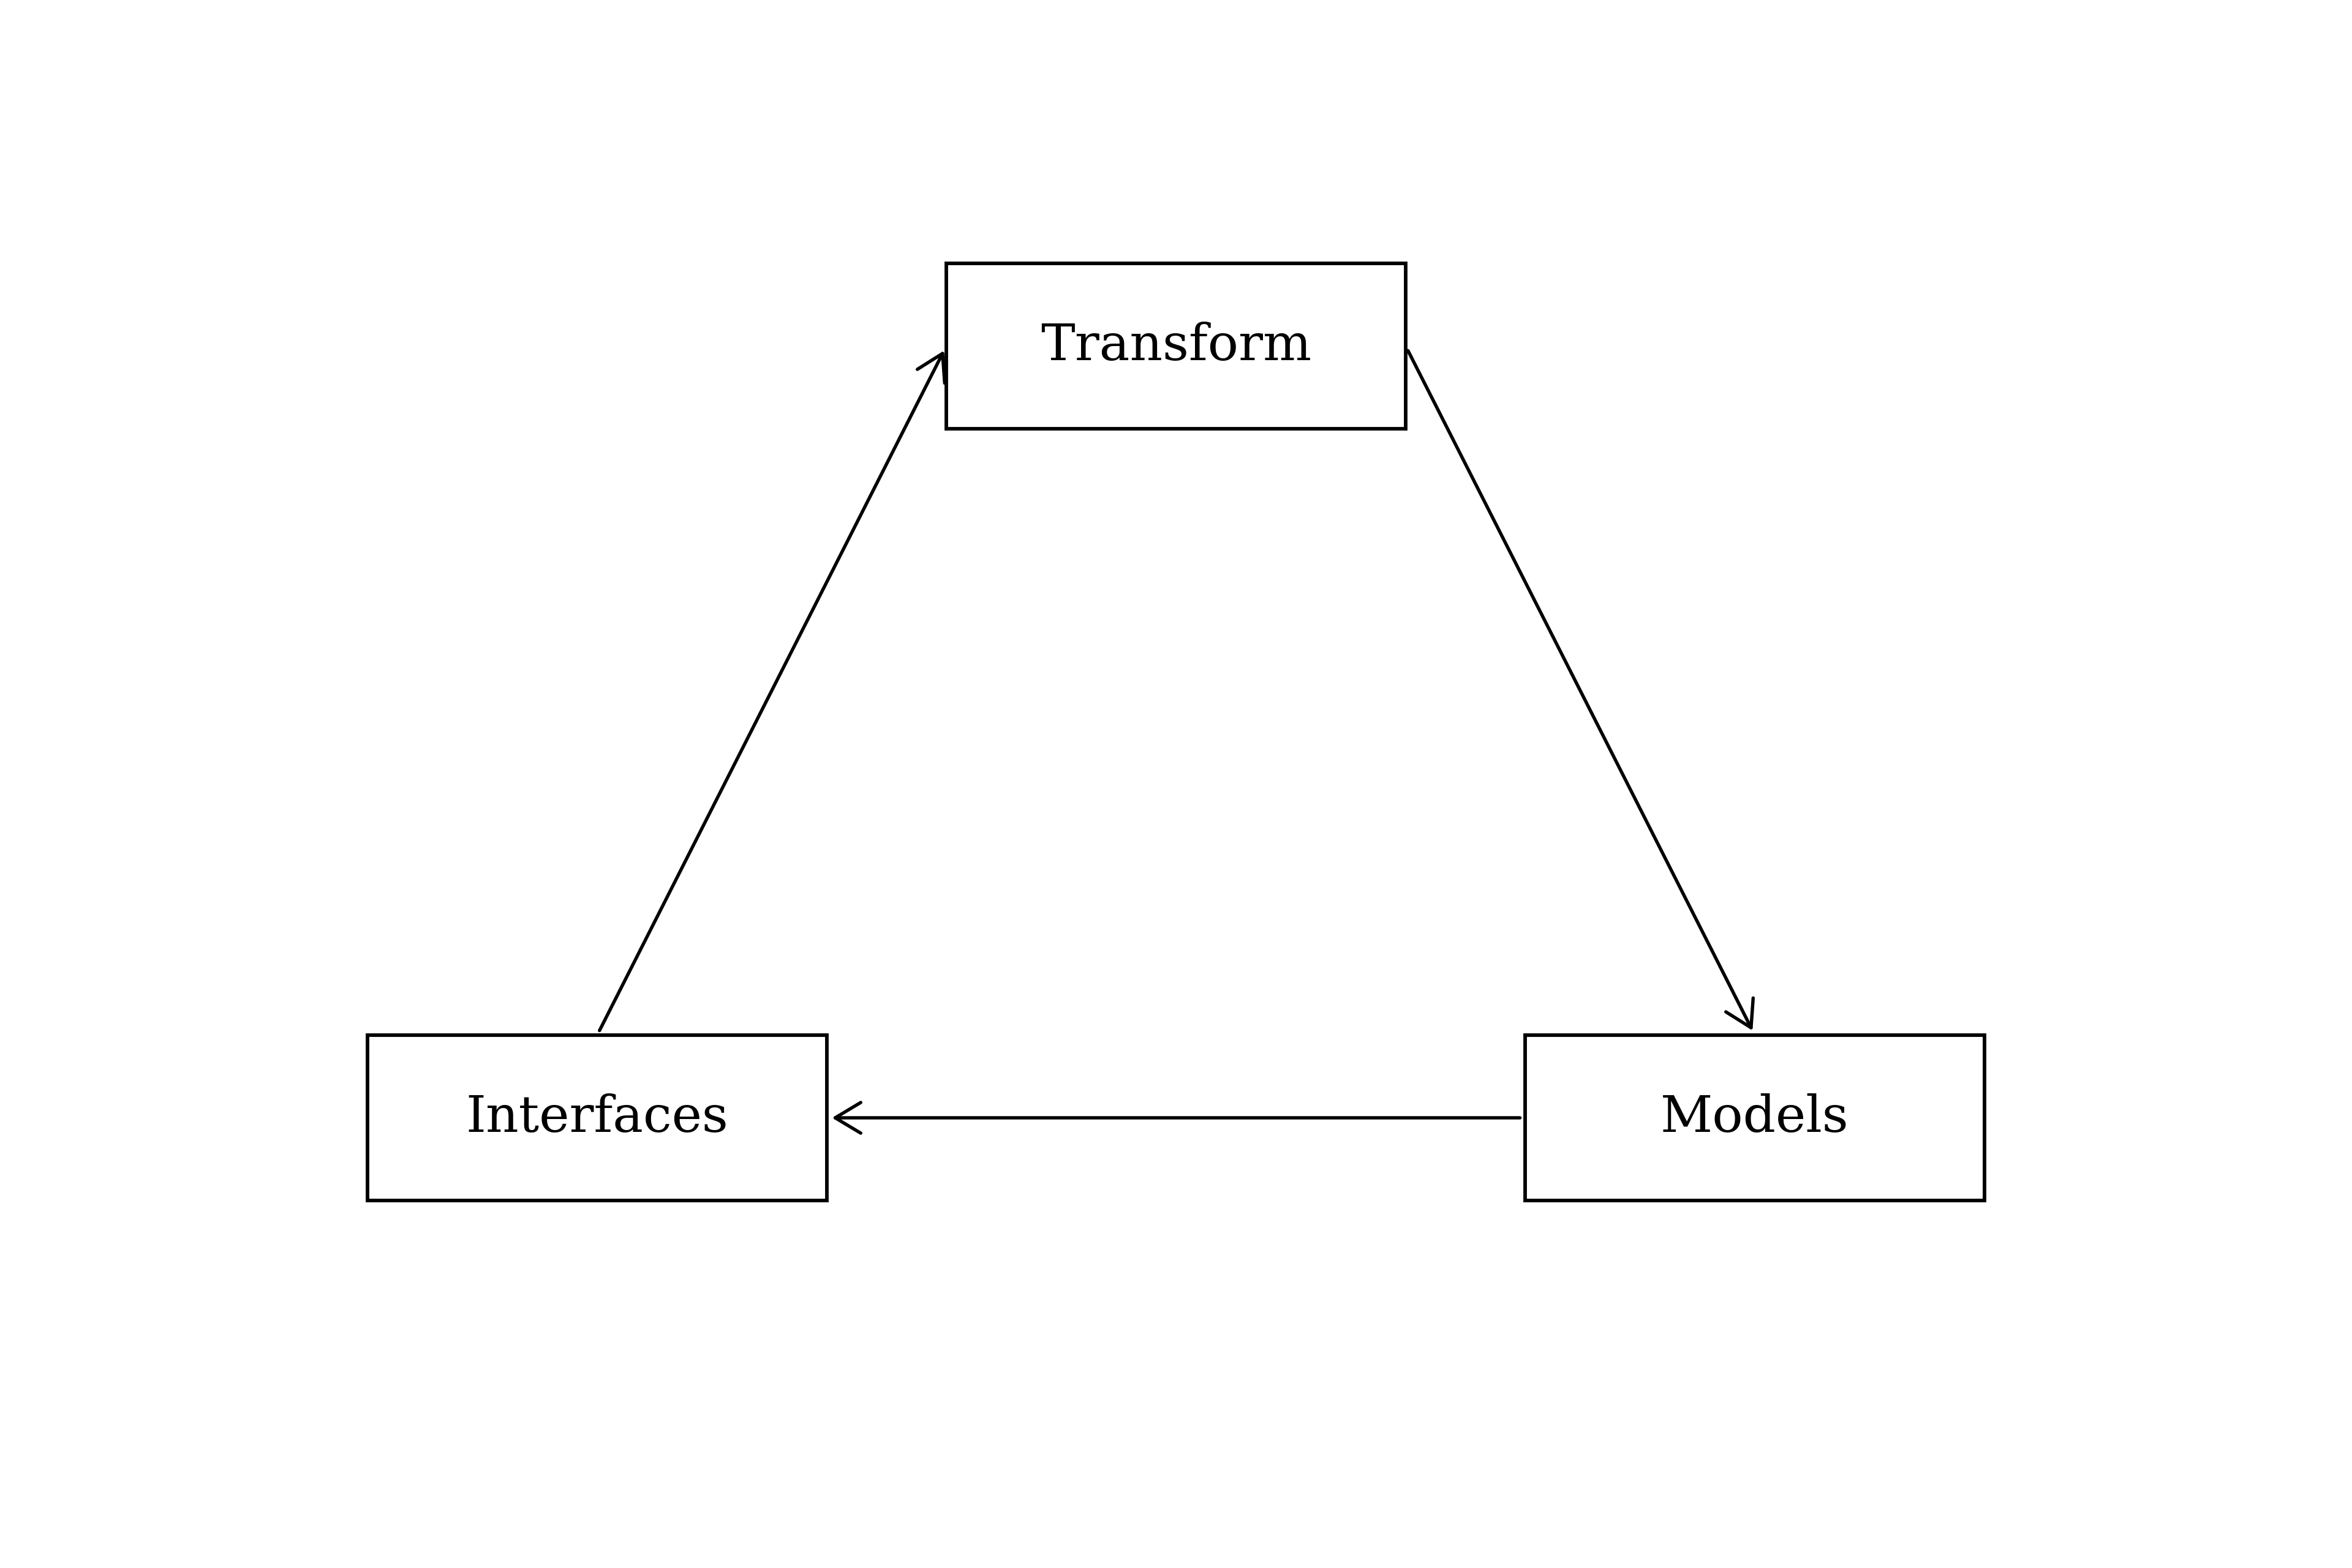
It is helpful to revisit and iterate in circles: how we transform the data, what models we want, what interfaces will be used. Continuously go around again, modifying the way we transform data so that we have the necessary inputs downstream. Some data sources will not meet all requirements for our schema. This is fine. We build dedicated models into the transformation phase to either enrich the data with additional metadata, or create ways of grouping temporal data to conform to our schema.
Inference from Clean Data
Once the data has been transformed and stored, the creative part begins.
A model is how you take stored data from the database and infer something from it. The word infer — to deduce or conclude information from evidence and reasoning rather than from explicit statements — closely aligns with the overarching goal of working with data. We should spend time making sure we have a solid model, so that from there we can infer valuable information.
Each model should tailor to a specific desired output. For the commission data flow, we want to understand the different products that are selling, and quantify them over different temporal spans. Breaking this into a pseudo-spec: I need the product rows, some way of identifying different product types, and temporal metadata about the time interval each record belongs to.
The Interface Layer
The second category is the interface: where our model is presented to the user so it makes sense to them, meeting them where they are so they can understand and make decisions with the data.
An interface is a point where two things meet and interact. The overarching purpose is to be the portal for the user into accessing all of their data maximally. Maximally means the models should be customizable, interactive, and not static.
If the user gets an idea of how they would like to query the data, the interface must meet that demand.
I believe there are currently two key forms of interfaces: natural language, and user-configurable modules. The example interface uses a combination of the two — leveraging the strengths of the modular configurable interface, and enhancing it with the simplicity of natural language. Language is used to orchestrate what you want. The modular interface is used to display it.
Tables That Breathe
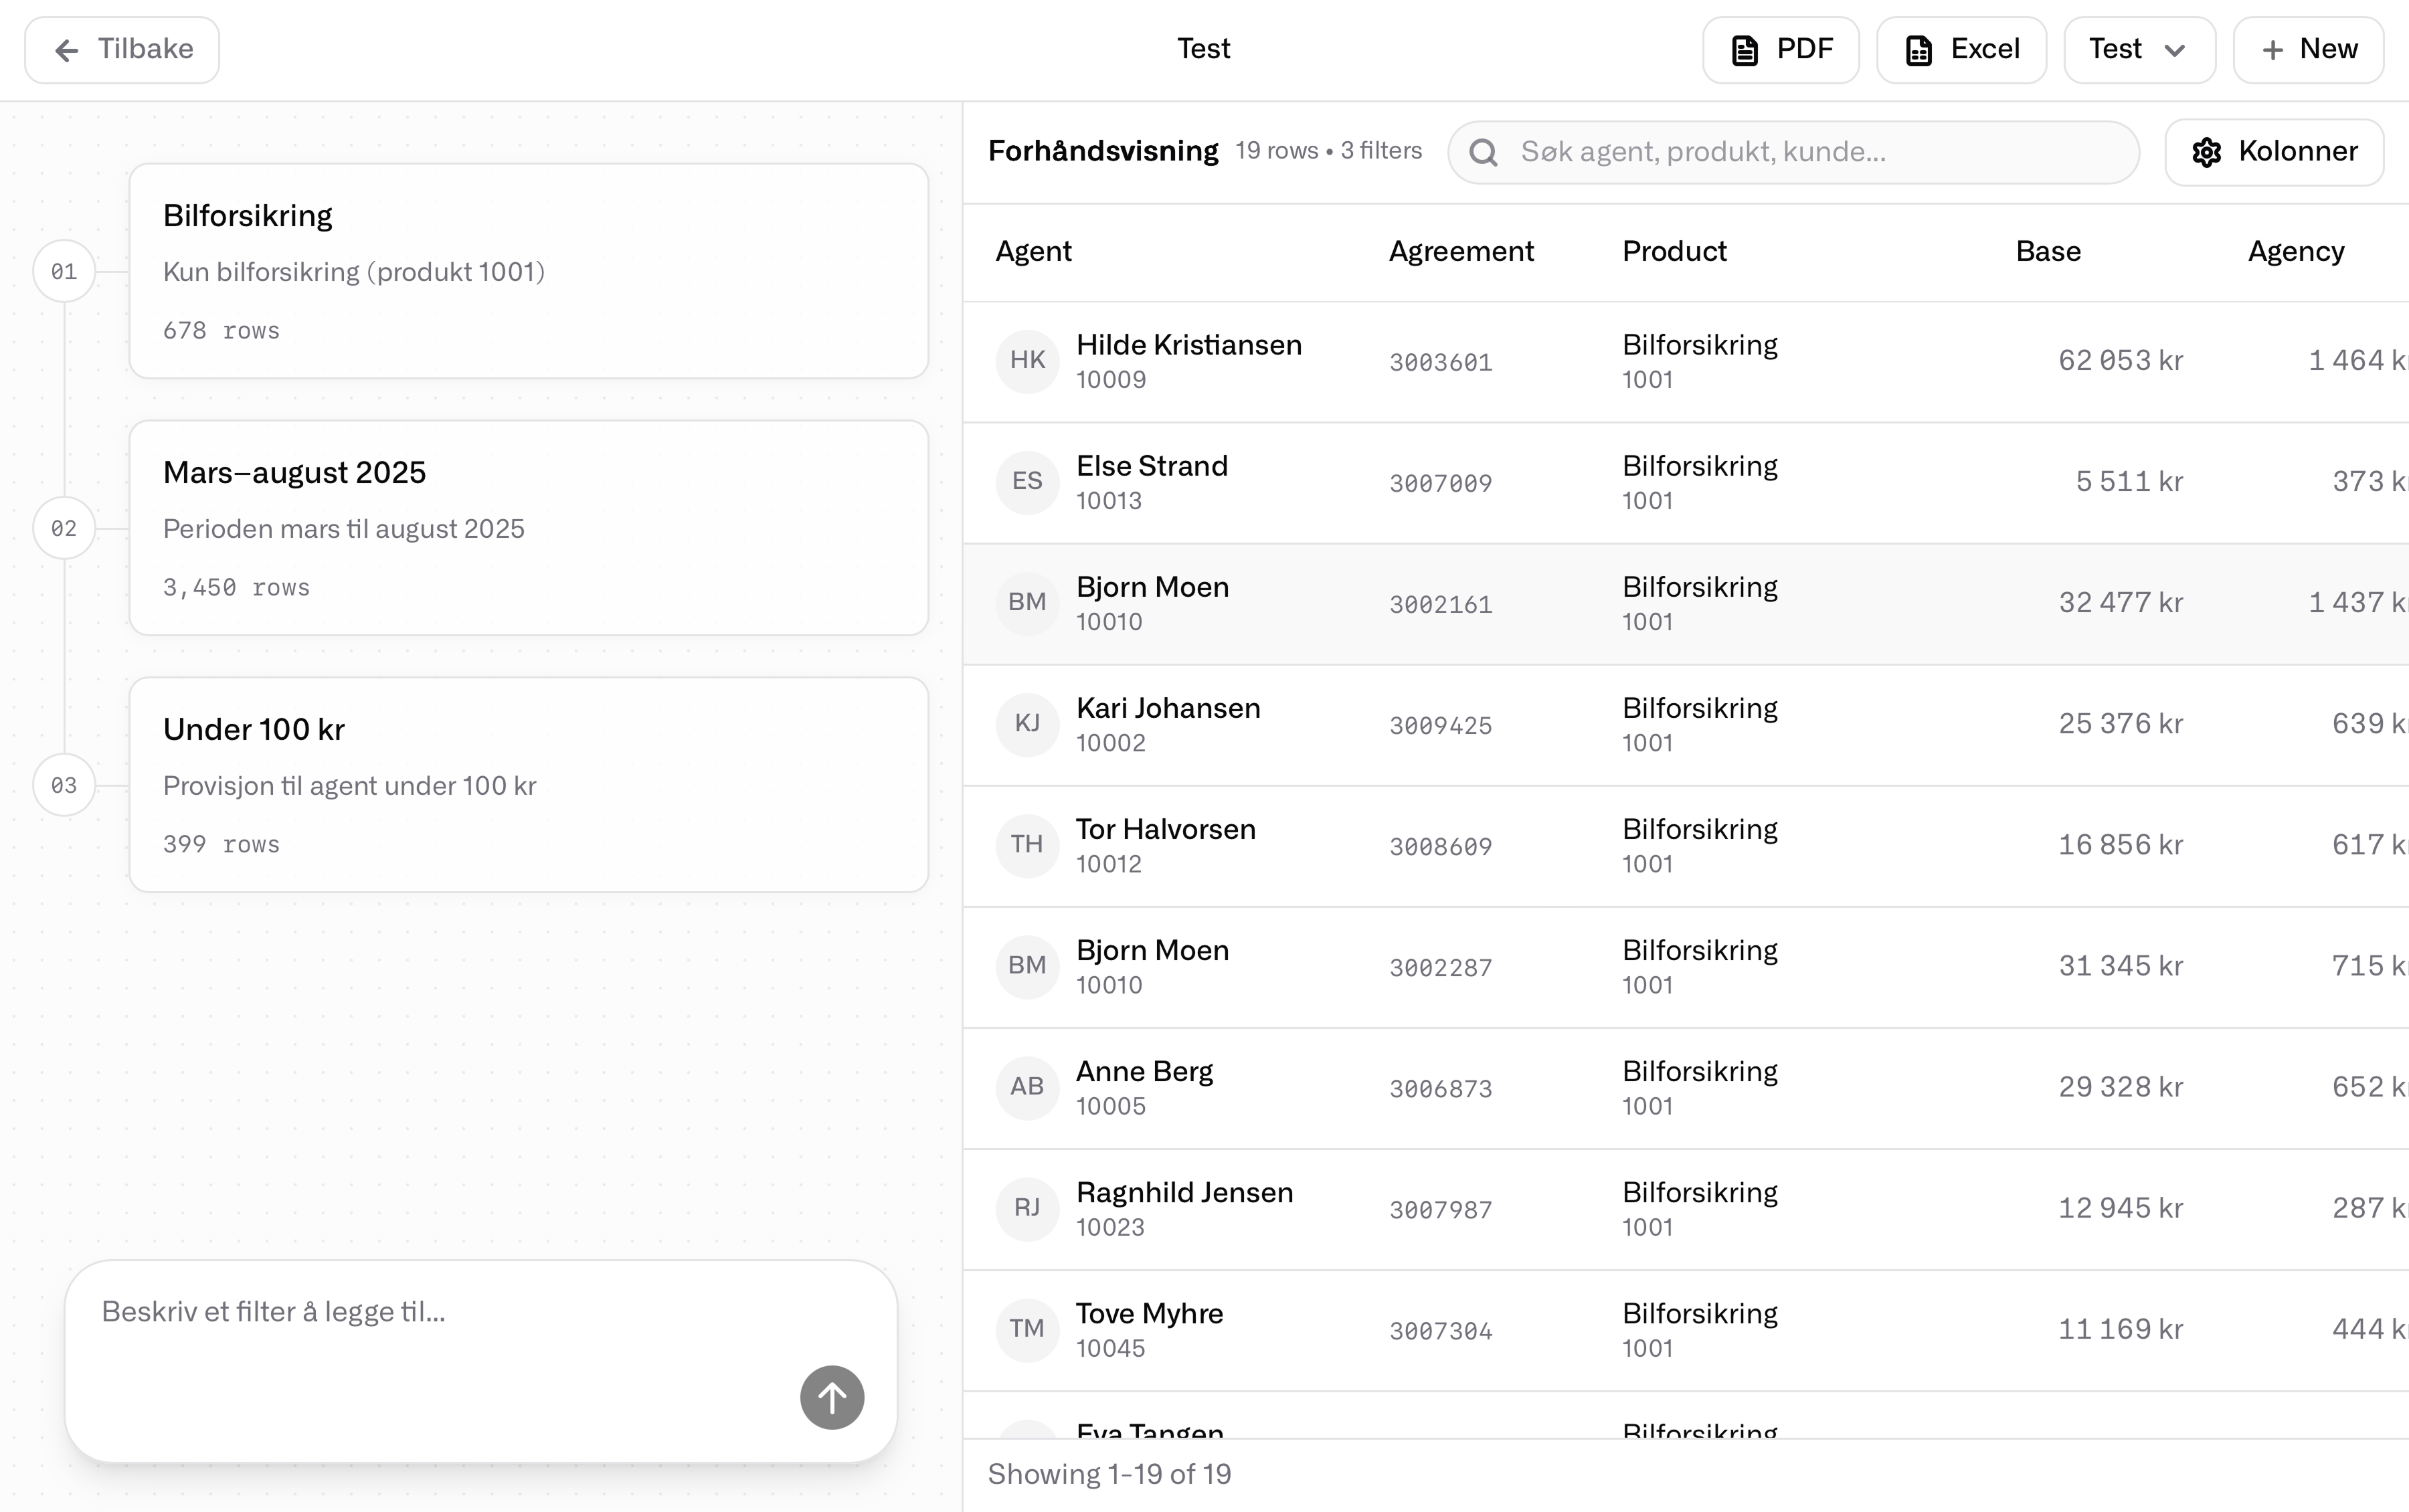
The interface is built with a hybrid of the accessible table-like design where content is displayed in a familiar spreadsheet way. Taller row heights and spacious column layouts are conscious decisions to make the spreadsheet visual a friendlier interface compared to a high-density spreadsheet. The overarching goal is to replicate the user's familiarity with a table while reducing the energy needed for comprehension. A natural next step would be visual representations of the underlying model, perhaps clear visuals comparing and differentiating the data as graphs.
Natural Language Interaction
This is where the power comes in. Instead of the traditional model of a spreadsheet with columns, rows, sorting, and filters, natural language introduces higher resolution of intent. The user explains their desired outcome in their preferred language, rather than conforming to the rules of a spreadsheet.
Speed follows from this. Instead of the human manually configuring filters and rules, the underlying system can figure out user intent and build a model of the desired output at the speed of a hundred words per second. The difference in time spent compared to building the same view in Excel or Google Sheets is stark.
An example: a user might want to see all car insurance products from March to August with commission to agent under $100. Imagine the work of doing this across thirty-plus Excel files. But from the exact line of text — "all car insurance products from March to August with commission to agent under $100" — here, there is plenty of signal inferable for an intelligent system. Our example interface creates the view within seconds from synthesizing the user intent into a model. The user does not need to know any code, only a language.
For practical use, the users can download their view into an exported file PDF or Excel. This allows them to take the data further, into whatever work they are doing. Familiar formats win here because they make the data portable and easily sharable.
How It Works: SQL Under Natural Language
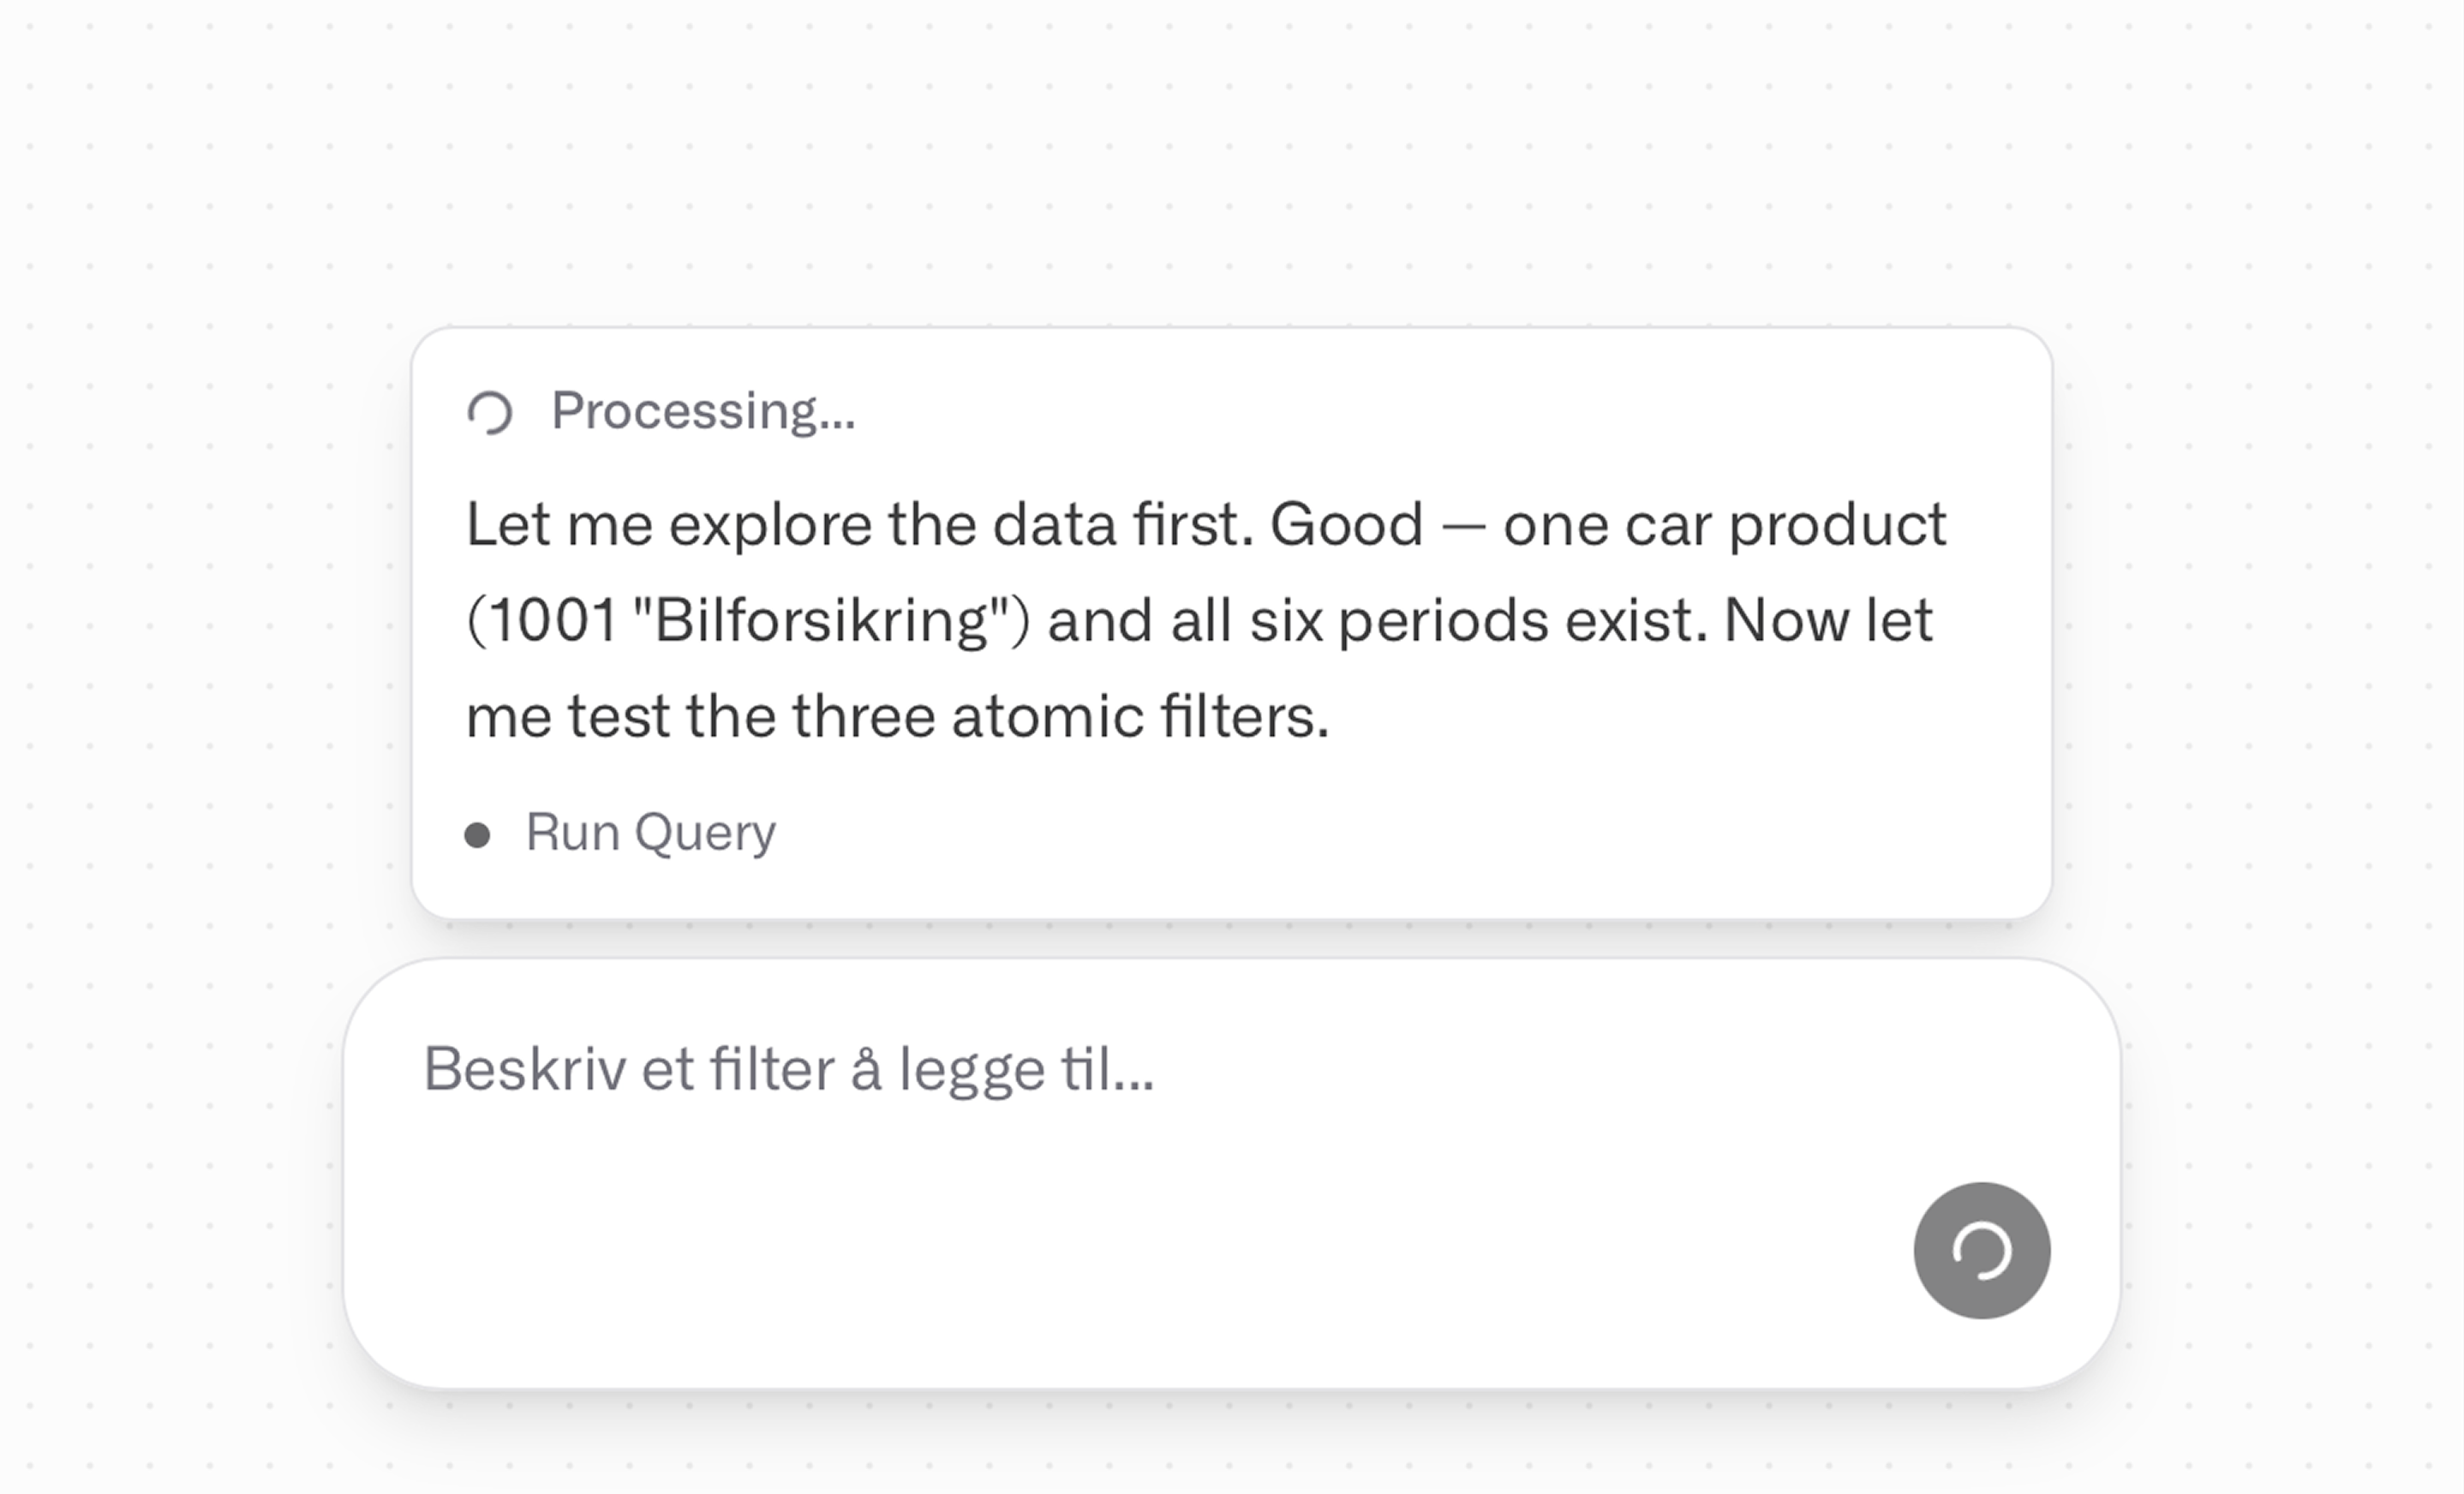
The LLM is the interpretation layer that receives the user intent, reasons over it, then begins an iterative process where it creates — through trial and error — the data model that satisfies the request. The interpreter returns the final data model back to the user interface for instant preview. A complete iteration takes less than thirty seconds.
An LLM most commonly refers to a Large Language Model, a type of Artificial Intelligence (AI) trained on massive amounts of data to understand, generate, and process human language.
Because of our heavy work upstream on clean and structured data, we have a perfectly predictable data source structure, as a result of our transformation, at this point in the pipeline. No matter the number of rows, the system iterates in seconds because of how the architecture is built.
The power here is the power of Postgres and SQL. Our LLM interpreter reads the user intent and writes SQL queries that shape our data model. Think of SQL like a language for prescribing data recipes: you write explicitly how to make a specific data dish. A recipe for making pizza scales no matter how many pizzas you make. SQL follows the same principle: no matter how much data you have, the recipe scales.
PostgreSQL (often shortened to Postgres) is a free, open-source object-relational database management system (ORDBMS). It is widely regarded as one of the most advanced and reliable database systems available.
SQL (Structured Query Language) is the standard programming language used to manage, query, and manipulate data within relational databases. It organizes data into structured tables with rows and columns, functioning as a sophisticated system for handling large volumes of information far beyond the capacity of traditional spreadsheets.
Beyond Commissions
The fundamentally interesting value of this interface is that it enables complete accessibility for any non-technical user to explore vast amounts of data. A few examples:
- Teachers with data about students and grades
- Accountants searching for specific receipts
- Researchers reviewing data quality
- Library inventory databases
- SaaS revenue analytics
- Investor modelling for capital allocation
Most data tools today assume a level of user expertise. I wanted to challenge that assumption. Instead of expecting the user to configure the system, why not let an AI do it? I believe this is the correct vision. The LLM becomes the configurator and the interpreter interface between raw human intent and structured data operations.
This interface is still in its infancy. There are many ways to improve the models, the interface design, and most importantly the accuracy of the LLM agent. At the boundary of any new technology, there is always a wide range of work to be done before the full value can be harvested. That is what makes it worth building.